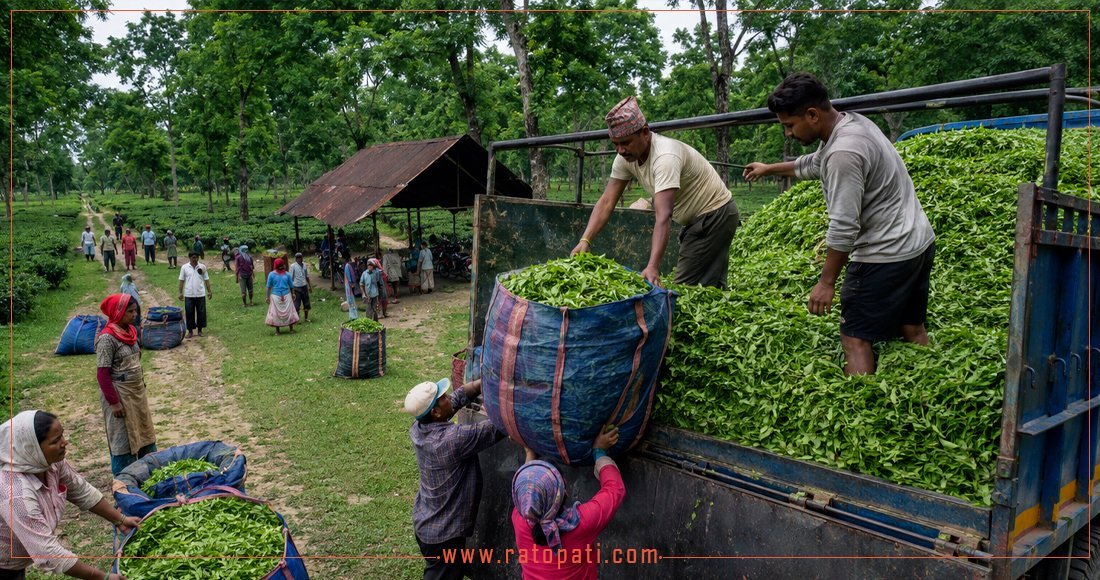
Nepal Rastra Bank report reveals top kitchen expenditures
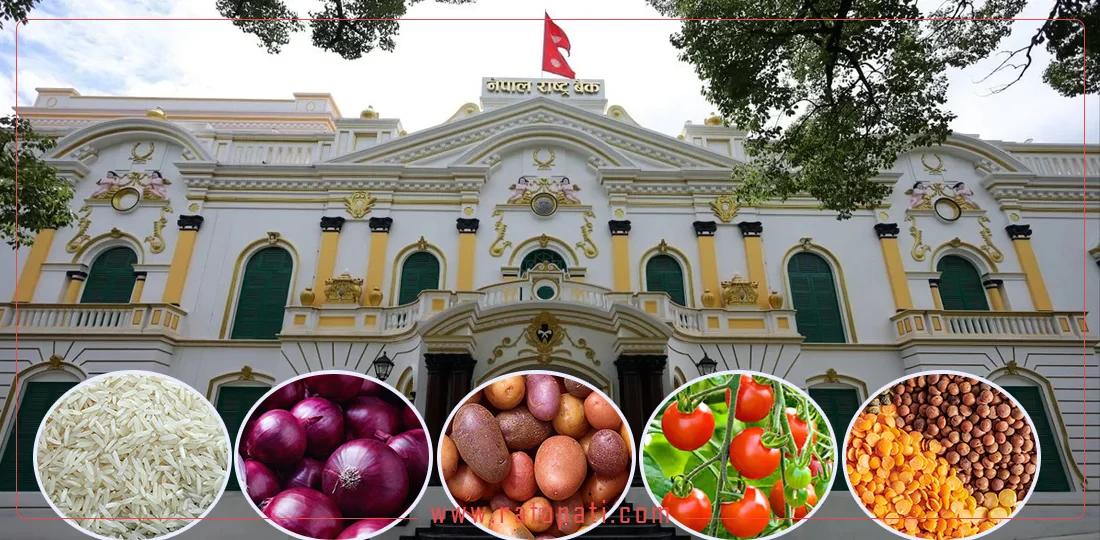
Kathmandu, October 14 — What do you spend the most on among kitchen essentials? It’s well-known that most people allocate their budgets to rice, lentils, vegetables, milk, fruits, and meat. However, have you ever considered which specific item incurs the highest expense?
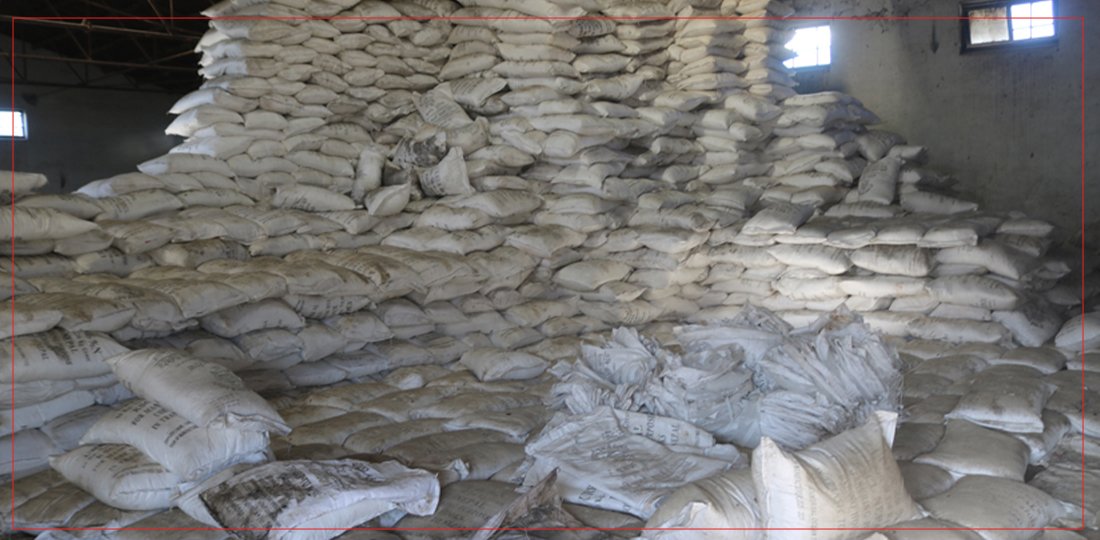
The Nepal Rastra Bank has identified commonly used household items for measuring inflation. A report prepared for the Consumer Price Survey lists 13 items in grains, 11 in lentils, 22 in vegetables, 5 in meat, and 13 in fruits as the most frequently used products. Here, we focus on items with the highest expenditures.
Rice accounts for 59% of grain expenses
According to the report, consumers across the country spend 58.51% of their total grain expenses on rice. Within this, 32.12% is spent on fine rice, while 26.31% is allocated to coarse rice.
Additionally, 14.45% is spent on wheat, flour, and other grain products, while biscuits and cookies account for 5.95%. Prepared noodles take up 5.54%, corn and corn flour make up 3.42%, bread, buns, and pastries account for 3.28%, and noodles comprise 2.64%. Other items such as millet, panipuri, bhujia, and pasta are also included in the market price survey, with total consumer spending on grains amounting to 8.0837%.
Lentils and pulses: Highest spending on black gram
Among lentils and pulses, the highest expenditure is on black gram, which accounts for 36.77% of lentil consumption. Following this, the demand for chickpeas and red lentils is also significant. The survey indicates that total spending on lentils and pulses amounts to 1.7580%.
Four vegetables comprise half of vegetable expenses
The report reveals that four vegetables account for half of all vegetable spending. The most consumed vegetables are potatoes, green leafy vegetables, cauliflower, and onions. Consumers typically allocate 4.6453% of their total spending to vegetables.
Of that, 19.64% is spent on potatoes, 13.79% on green leafy vegetables, 8.76% on cauliflower, and 7.98% on dried onions, indicating that these four vegetables together comprise 50.13% of vegetable expenditures.
Fruit spending highlights
In terms of fruits, apples are the most expensive, making up 29.44% of total fruit spending. Other significant expenditures include 17.98% on bananas, 11.07% on oranges, and 7.76% on cashews, raisins, almonds, and coconuts. Consumers allocate 3.2341% of their total budget for fruits.
Meat expenditure insights
The survey shows that 5.7566% of spending is on meat. Notably, expenses for goat meat are nearly equivalent to those for chicken. Chicken accounts for 40.86% of meat expenditures, while goat, sheep, and ram meat together account for 34.45%. Fish represents 8.89%, while buffalo and cow meat account for 8.59%, and pork and wild boar comprise 7.22%.
Officials from the Nepal Rastra Bank and the National Statistics Office suggest that while chicken is in high demand, goat meat is typically more expensive and often used for special occasions, explaining the observed spending patterns.